How to Measure Customer Satisfaction? Overview of CSAT and NPS Metrics | Recommended Customer Satisfaction Survey Tools

This article thoroughly explains the three major metrics for measuring customer satisfaction—CSAT, NPS, and CES—along with their definitions, calculation formulas, and benchmark values. It also provides a five-step survey design process and six key practices for improving satisfaction, assisting small and medium enterprises in upgrading from feeling management to data management.
Customer satisfaction is a core indicator for businesses to measure how customers feel about their products or services overall. It is often tracked using three sets of quantitative tools: CSAT (Customer Satisfaction Score), NPS (Net Promoter Score), and CES (Customer Effort Score). CSAT reflects the quality of immediate interactions, NPS predicts long-term brand loyalty, and CES assesses the difficulty of problem resolution. The three metrics complement each other to fully grasp the customer experience. In the past, small and medium enterprises in Taiwan lacked systematic tools and relied on gut feelings to assess customer service performance; now, by implementing an customer satisfaction dashboard, these three metrics can be transformed into daily measurable figures, allowing customer service supervisors to evolve from "firefighting by intuition" to "actively retaining customers using data". This article fully explains the definitions, calculation formulas, benchmark values of CSAT, NPS, and CES, as well as practical implementation methods for small and medium enterprises in Taiwan.
What is CSAT? How is Customer Satisfaction Score Calculated?
CSAT (Customer Satisfaction Score) is the most intuitive customer service measurement tool. After a conversation, an order, or a service process ends, the system automatically sends a rating question to customers: "How satisfied are you with this service?" The options are usually rated from 1 to 5 stars or on a scale from "very dissatisfied" to "very satisfied".
CSAT Calculation Formula:
CSAT (%) = Number of Satisfactory Responses (4 or 5 points) ÷ Total Number of Responses × 100
For example: If 200 ratings are received in a week and 160 of them give 4 or 5 stars, then CSAT = 160 ÷ 200 × 100 = 80%.
How to Interpret CSAT Benchmark Values?
Table: Common CSAT Benchmarks and Corresponding Actions
| CSAT Value | Meaning | Recommended Action |
|---|---|---|
| Above 90% | Excellent service, highly satisfied customers | Maintain status quo, identify reproducible best practices |
| 70%-90% | Good, above industry average | Delve into low score cases to trace root causes |
| 50%-70% | Average, still significant room for improvement | Perform systematic analysis of negative reviews, prioritize improving frequent pain points |
| Below 50% | Warning sign, widespread customer dissatisfaction | Immediately initiate customer complaint analysis, suspend marketing investments |
The greatest advantage of CSAT is itsproximity to each transaction, which allows for accurate identification of which service aspect is problematic. The downside is the low response rate (usually 10%-30%) and it only reflects the feelings from the most recent interaction, not long-term loyalty.
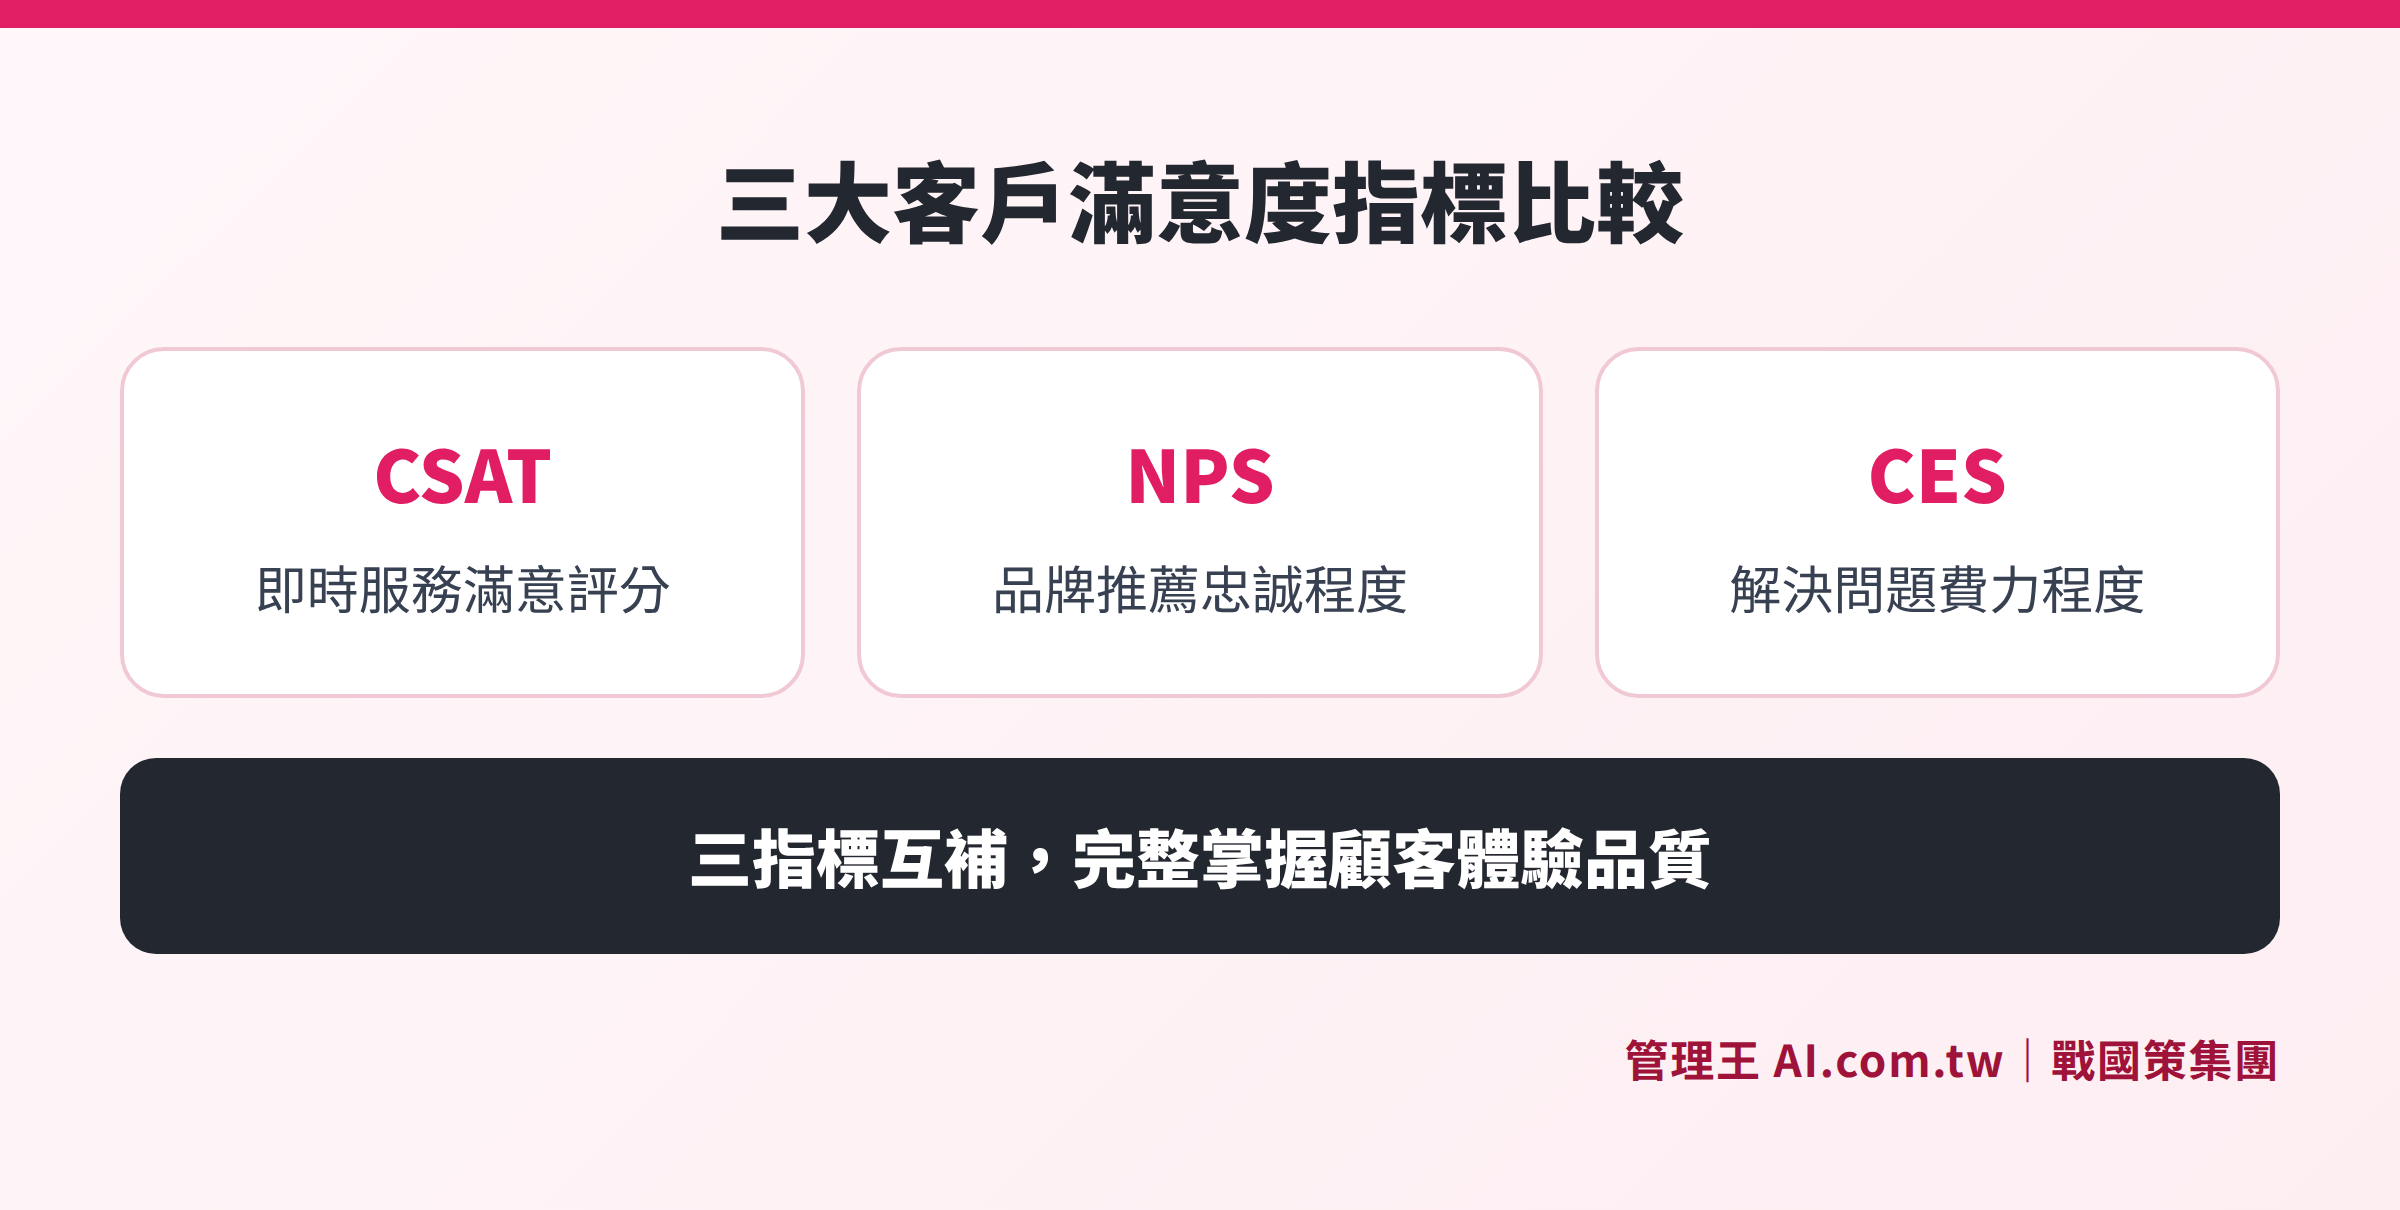
CSAT measures immediate satisfaction, NPS measures willingness to recommend, CES measures ease of resolution; the three complement each other without being mutually exclusive
What is NPS? How is Net Promoter Score Used to Measure Brand Loyalty?
NPS (Net Promoter Score) was introduced by Fred Reichheld and Bain & Company in 2003 and measures overall customer loyalty to a brand through a core question: "How likely are you to recommend us to a friend or colleague?" This is rated on a scale from 0 to 10.
Based on the score, customers are categorized into three types:
- Promoters: 9–10 points, active ambassadors of the brand
- Passives: 7–8 points, satisfied but not enthusiastic
- Detractors: 0–6 points, potentially spreading negative feedback
NPS Calculation Formula:
NPS = Percentage of Promoters (%) - Percentage of Detractors (%)
The result ranges from -100 to +100. A positive number means there are more promoters than detractors, and an NPS of over 50 is considered excellent; a negative number indicates a need to reassess the customer experience.
In One Sentence
NPS = Proportion of Promoters (9-10 points) minus Proportion of Detractors (0-6 points); only positive numbers count as passing, and over 50 is excellent.
The core value of NPS lies in its ability to predict growth: research by Bain & Company found that a 5 to 10 percentage point increase in NPS often corresponds to revenue growth for a company; a decline in NPS indicates a warning sign of customer attrition, surfacing the problems months before quarterly reports reveal them.
NPS Industry Benchmarks
Table: NPS Benchmarks for Various Industries (2024 Global Data)
| Industry Type | Good NPS | Excellent NPS |
|---|---|---|
| Retail / E-commerce | Above 45 | Above 65 |
| Software / SaaS | Above 30 | Above 50 |
| Financial Services | Above 20 | Above 40 |
| Telecommunications | Above 15 | Above 30 |
| B2B Services | Above 25 | Above 45 |
*Industry benchmarks may vary slightly each year; please refer to the latest announcements from various industry associations.*
The limitation of NPS is that it reflects an overall impression and cannot accurately correspond to specific customer service personnel or procedures; thus, in practice, it should be paired with a follow-up question: "What made you give this score?" to transform the overall score into specific actionable improvement points, allowing the team to understand where to focus next.
What is CES? What Does Customer Effort Score Represent?
CES (Customer Effort Score), the most recently introduced of the three metrics, was put forth by Gartner researcher Matthew Dixon et al. in a 2010 Harvard Business Review article. CES measures how much effort customers need to exert to resolve a problem or complete a task, with the core question usually being: "Did [Company Name] make it easy for you to resolve your issue?"
The rating scale is typically from 1 to 7, where lower scores indicate less effort (some versions may be presented the other way, ranging from "strongly agree" to "strongly disagree").
Why is CES Important?
Research by Gartner found that reducing customer effort is more effective in enhancing loyalty than "delighting customers" or "exceeding expectations." When customers have to repeatedly explain their issues, get transferred multiple times, or cannot find the right entry point, even if their problems are ultimately resolved, their likelihood of leaving significantly increases. Customers with high CES (who experience greater effort) are four times more likely to churn than those with low effort.
CES is best used in:
- After-sales service or after the completion of return/exchange processes
- After a walkthrough of operations or feature explanations
- After multiple transfers or waiting periods concluding a case
Complete Comparison of CSAT, NPS, and CES Metrics
Each of the three metrics has its strengths; small and medium enterprises usually do not need to implement all three simultaneously. Instead, they should choose one primary metric based on their current pressing issues, while using the other two for supplementary tracking.
Quick Judgment: Which Metric to Prioritize?
- When just starting to build a customer service system: Begin with CSAT, set up automated scoring, and see the numbers immediately.
- When wanting to know the brand's position in customers' minds: Regularly conduct NPS surveys to observe quarterly trends.
- When the reasons for customer attrition are unclear: Incorporate CES to find out which processes customers find troublesome.
Once all three metrics are established, they should be cross-analyzed: a high CSAT but low NPS indicates that while each service encounter is satisfactory, the overall brand impression needs strengthening; a high CES points to overly complicated processes, which might cause even satisfied customers to quietly leave.
How to Design Customer Satisfaction Surveys? Five Practical Steps
Many companies conduct satisfaction surveys but never take action, often due to improper design, low recovery rates, or incomprehensible data. The following five steps will help you establish a truly useful customer satisfaction survey mechanism:
1. Determine the Timing of the Survey
Do not disturb customers at the most inappropriate times. Optimal survey triggers include:
- 5 to 10 minutes after customer service conversation closure (measuring CSAT)
- 24 hours after important orders are shipped (measuring CSAT)
- Once each quarter for active customers (measuring NPS)
- After operational explanations or guided questions are completed (measuring CES)
2. Control the Number of Questions
A survey with more than three questions sees completion rates drop sharply. One main rating question + one open-ended question is the best combination. For example: CSAT rating (1–5 points) + "What was the most satisfying aspect of our service?" or "What do you wish we could improve?"
3. Choose the Right Distribution Channel
In Taiwan, the open rate for LINE notifications is significantly higher than for Email. Recommendations include:
- For general consumers: Send surveys via LINE official accounts
- For B2B clients: Use Email accompanied by follow-up calls
- For in-person services: Provide QR codes on-site for filling out
4. Set Up Immediate Notifications for Negative Reviews
If a customer gives a score of 1 or 2 (CSAT), or NPS is in the range of 0–6 (detractors), the system should notify supervisors within 10 minutes; the quicker the intervention, the higher the success rate in remediation.
5. Monthly Review of Numbers, Quarterly Process Changes
The value of satisfaction numbers lies in long-term trends, not in isolated highs and lows. Establish monthly reports to track CSAT trends, identify low-scoring peaks at specific times or events, and adjust at least one customer service process each quarter based on the data.
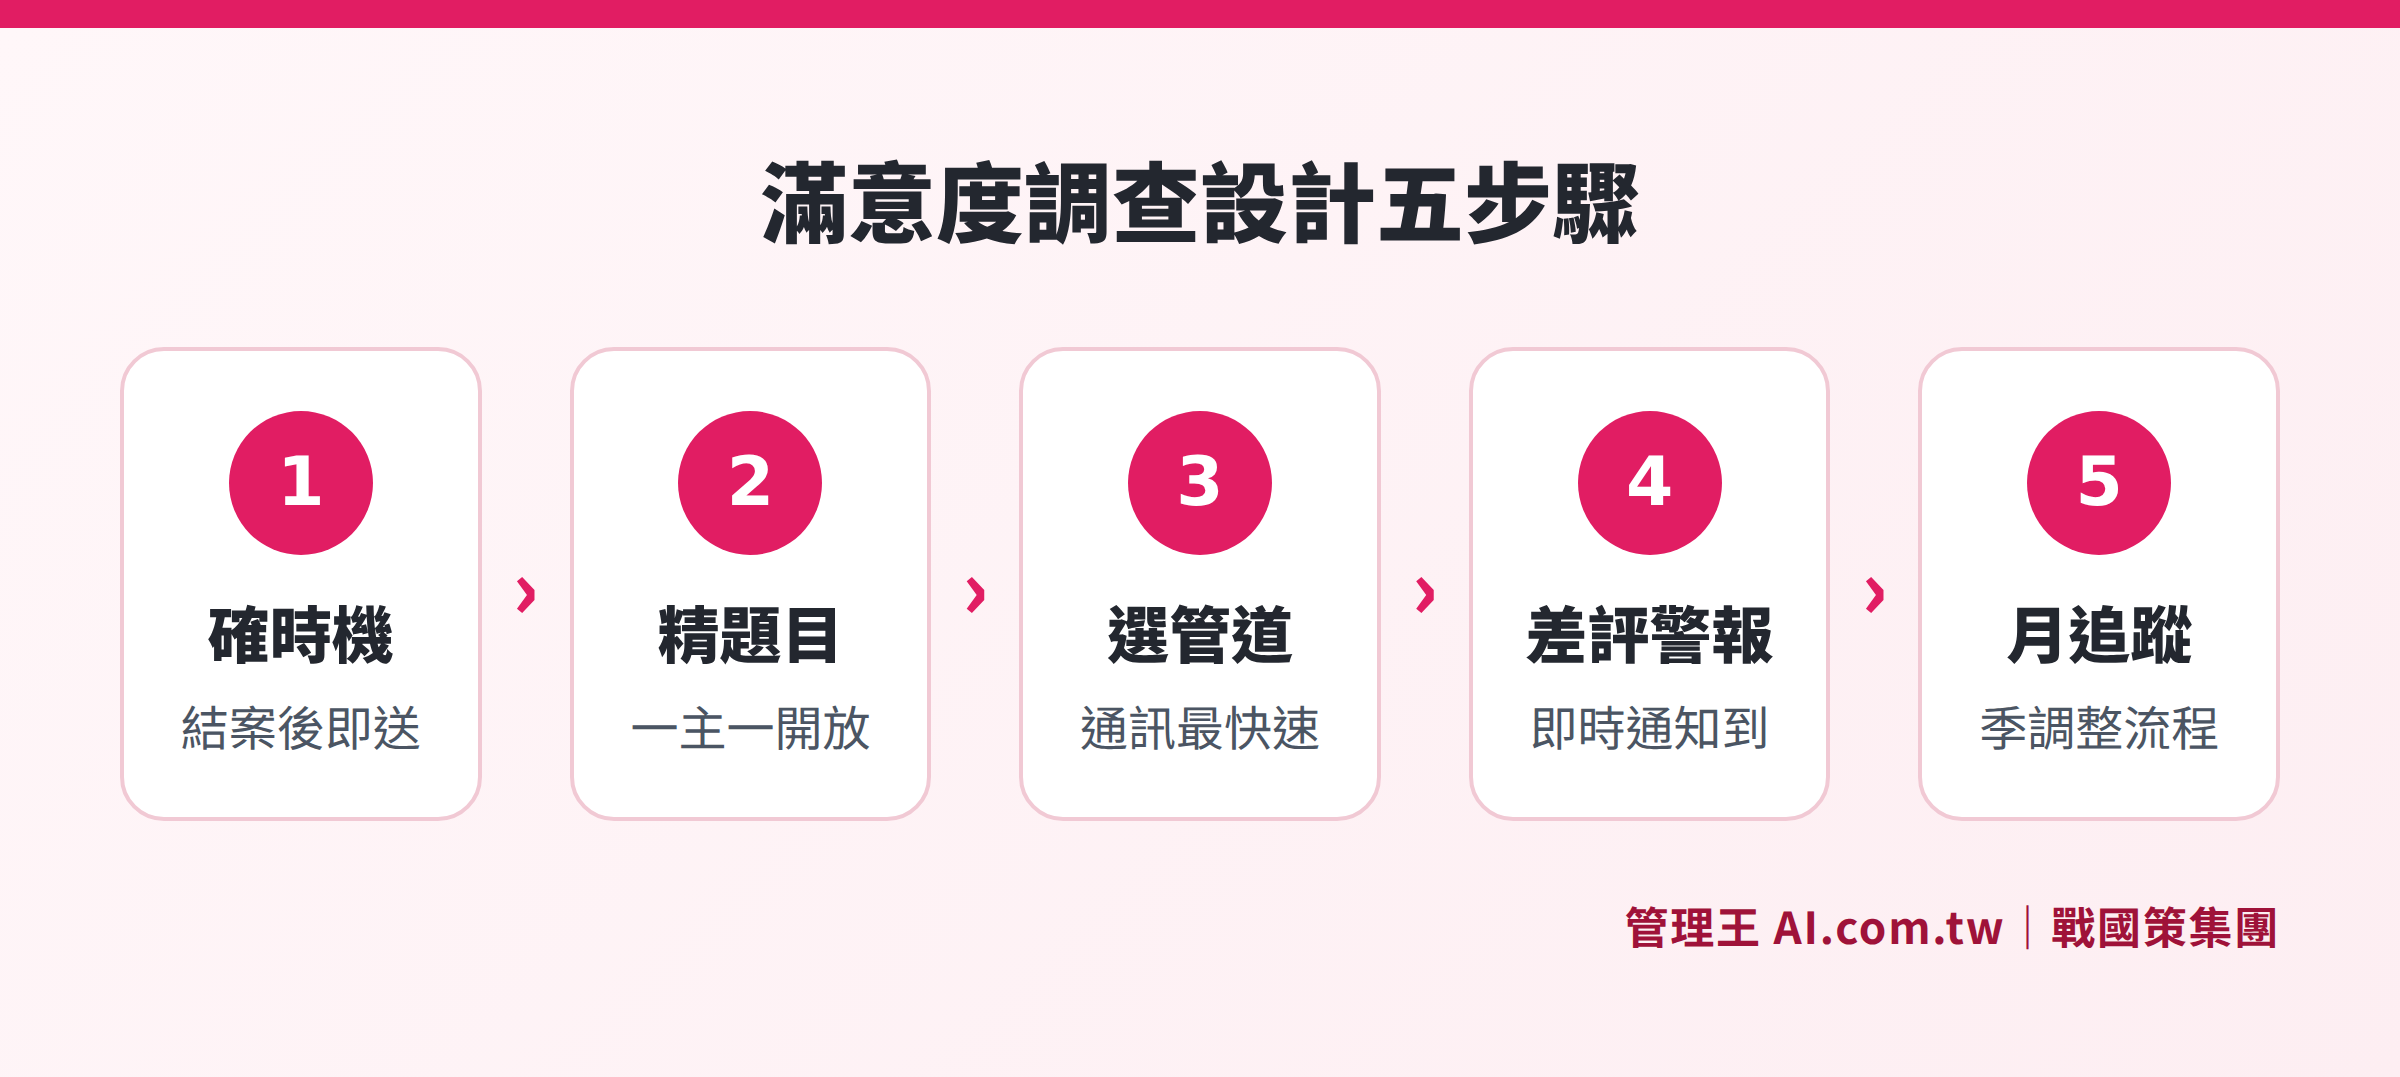
Confirm survey timing, control question count, select the right channel, set up immediate notification for negative reviews, and iterate on processes monthly and quarterly
First Contact Resolution (FCR): An Essential Fourth Metric for Measuring Customer Service Efficiency
In addition to the three major metrics of CSAT, NPS, and CES, First Contact Resolution (FCR) is a key efficiency metric that many customer service supervisors need to track but often overlook. FCR measures whether a customer’s issue can be completely resolved during the first contact, eliminating the need for further follow-up or referral.
FCR Calculation Formula:
FCR (%) = Number of Issues Resolved on First Contact ÷ Total Number of Contacts × 100
FCR is highly positively correlated with CSAT: for every 1 percentage point increase in FCR, CSAT typically rises by about 1 percentage point as well. Conversely, if customers need to contact multiple times to resolve an issue, their dissatisfaction chances significantly increase.
Common Causes of Low FCR
- Incomplete Knowledge Base: Customer service representatives do not know the answers and have to tell customers to "please hold on" or "I'll check on that".
- Insufficient Authority: Customer service representatives want to help customers resolve issues but need managerial approval for refunds or exchanges.
- Cross-Department Hurdles: Issues require collaboration from warehouses, finance, and technical departments, leading to miscommunication.
- Excessive Transfers: Each transfer requires re-explaining the issue, which drives up CES.
Enhancing FCR can most effectively be achieved by enabling customer service representatives to see all necessary information directly within the conversation interface—customer history, order status, refund policies, common problem resolutions—without needing to switch between five different windows.
Six Key Strategies for Improving Customer Satisfaction
Knowing the numbers is just the beginning; the challenge is how to keep those numbers rising. The following six aspects are the most commonly overlooked levers for improving satisfaction among small and medium enterprises in Taiwan:
1. Shorten First Response Time (FRT)
Research consistently shows that what customers care most about is not whether the answers are correct, but whether they are being acknowledged. Set SLA targets: B2C customer service should respond within 2 hours for the first reply, and B2B important clients should receive a response within 30 minutes. Utilize an AI customer service system to ensure zero missed calls by having a bot assist initially.
2. Reduce Transfer Frequency
Each additional transfer raises CES. Establish a complete customer service skill matrix, assigning issues to the person best able to resolve them, avoiding the cycle of "I’ll transfer you to another department." The intelligent dispatch feature of a customer service ticket system can automatically allocate tasks based on semantics, skills, and workload.
3. Enable Customer Service Representatives to See the Complete Customer History in Conversations
Customers hate having to repeat themselves, saying, "I've already mentioned this last time." When customer service representatives open a chat window, they should simultaneously see the customer’s order history, past complaints, VIP status, and purchased plans; this requires deep integration of the CRM and customer service systems.
4. Build a Knowledge Base, Allow AI to Handle Repetitive Questions
Questions like "How to cancel an order?", "When will the invoice be sent?", or "What to do if I forget my password?" account for 60%-70% of customer service volume, and relying solely on human responses is a waste of resources. Organize these questions into an AI knowledge base, allowing robots to respond automatically within 30 seconds, letting customer service handle only cases that truly require judgment.
5. Establish a SOP for Negative Reviews, Turning Crisis into Opportunity
If customers who give a score of 1 or 2 are personally contacted by a supervisor within 24 hours and their issues are resolved, over 70% will raise their scores or even become loyal customers. Negative reviews are not scary; not having a follow-up SOP is.
6. Regularly Share Numbers with the Entire Team
CSAT and NPS should not be secrets reserved for supervisors. Announce weekly customer satisfaction ratings in group chats so that every customer service employee can see their numbers; this is the most effective and cost-efficient incentive method.
How to Use 管理王's Customer Satisfaction Dashboard?
管理王 AI.com.tw's customer satisfaction dashboard integrates CSAT, NPS, and CES metrics into one interface, allowing small and medium enterprises to comprehensively track service quality without the need to connect multiple tools.
Automatic Rating Push After Conversations
After each conversation concludes, the system automatically sends CSAT rating invitations (1–5 points) via LINE or Email, and can be set to automatically send NPS surveys to active users every quarter. There’s no need for manual operations, ensuring zero loss.
Overview of Three Core Metrics on One Page
The dashboard displays the CSAT trend graph, current month's NPS distribution, and average CES scoring simultaneously, so supervisors can see yesterday's figures at a glance upon starting work without needing to export Excel for reporting.
Real-Time Alerts for Negative Ratings, Intervene Within 10 Minutes
Any score of 1 to 2 stars is automatically flagged and notifies supervisors via LINE, along with AI complaint root cause analysis that automatically summarizes negative review keywords, allowing supervisors to know the week’s biggest complaints without having to read through each one.
Individual Performance Tracking for Customer Service Representatives
Monitor individual CSAT ratings, response times, and completed case numbers for each customer service employee, providing an objective basis for performance assessments, and can also show the growth curve of new hires within three months, making personnel development more evidence-based.
Cross-Channel Effectiveness Comparison
Satisfaction differences across various channels—LINE, Email, website conversations—are presented in one table, helping supervisors determine which service channel needs strengthening and which processes require optimization.
Survey Tool for In-Depth Investigation
In addition to automatic ratings, custom surveys can be designed (e.g., "Which function would you most like us to improve?") and the survey results automatically imported into the CRM, allowing both sales and customer service to view the same comprehensive customer feedback.
Automatic Calculation of FCR for First Contact Resolution
管理王's customer service ticket system automatically records the handling times for each ticket, determining whether it was “resolved on first contact” and presenting the FCR figure on the dashboard weekly. Supervisors do not need to manually calculate, thereby identifying issues with low first contact resolution rates, whether due to knowledge base gaps or authorization problems.
Unified Inbox Across Channels
All communications from LINE, Email, and website conversations are collected into a unified inbox, preventing customer service from switching apps and customers from having to repeat themselves, which naturally reduces CES. Additionally, with AI phone service, complaints over the phone can also be automatically converted into tickets and a CSAT rating can be pushed.
The free plan can be used permanently for basic customer service functions. For more advanced CSAT trend analysis, automatic NPS surveys, and AI root cause analysis, upgrade to a paid plan (starting from NT$5,000/month). For any inquiries, please refer to the Customer Service System Purchasing Guide or Complete Explanation of the Ticket System.
Create Your Customer Satisfaction Dashboard for Free
Consultants will assist in setting up automatic tracking for CSAT and NPS, digitizing customer service performance metrics, with a free plan that is permanently available, and registration takes only 30 seconds.
Free Consultation Hotline: 0800-003-191
LINE Official Account: @119m
Official Website: app.AI.com.tw
Free Trial: Apply for Management King Immediately
Frequently Asked Questions
What Are the Differences Between CSAT and NPS, and Which One Should I Choose?
CSAT measures immediate satisfaction after each interaction, making it suitable for monitoring daily customer service quality; NPS measures overall brand loyalty, useful for understanding whether customers are willing to recommend. Both are suggested to be used together: measure CSAT after each service closure and send NPS to active customers each quarter. If you can only choose one, customer service supervisors should start with CSAT, while brand or marketing supervisors should use NPS first.
What If My Customer Satisfaction Survey Response Rate Is Too Low?
Three key ways to improve response rates: First, shorten the survey to 1 or 2 questions (CSAT score plus one open-ended question); second, send it as close to the service’s conclusion as possible (within 5 minutes is optimal); third, use LINE notifications instead of Email (open rates are about 3 times higher in Taiwan). The automatic push function of the 管理王 customer satisfaction dashboard can achieve all three of these points.
Does an NPS Below 0 Mean the Company Is in Trouble?
A negative NPS is indeed a warning sign, indicating there are more detractors than promoters, but it does not directly equate to declining performance. Many businesses experience short-term dips in NPS due to product revisions, policy adjustments, or service process changes causing temporary discomfort. The focus should be on identifying the causes for the NPS decline: when it began, which customer segments are affected, and what the reasons are, then to improve accordingly.
Do Small Companies Need to Conduct Customer Satisfaction Surveys?
The cost of losing each customer is higher for smaller companies, making it even more crucial to detect satisfaction issues early. Even if there are only 10 services per day, continuously tracking CSAT can reveal which customer service representatives need improvement and identify recurring issues. The free plan of 管理王's customer satisfaction dashboard can be used for basic functions, allowing even small teams of 5 to establish formal data tracking practices.
How to Lower CES Scores?
The core methods to reduce CES are: first, minimize transfer frequencies (each transfer increases effort); second, provide a comprehensive knowledge base for common issues so customers can self-help; third, unify the inbox so customers don’t have to repeatedly explain problems across multiple channels. Connecting the AI customer service center with AI phone service is the most effective systemic means to lower CES.
Data Sources
- Bain & Company — Net Promoter Score System (Definitions, calculation formulas, and applications for NPS; NPS® is a registered trademark of Bain & Company, NICE Systems, and Fred Reichheld)
- Bain & Company — Net Promoter 3.0 (Latest interpretation of NPS calculation methods)
- startcompany.tw — How to Measure Customer Satisfaction: A Comprehensive Guide to Metrics and Methods (CSAT, NPS, CES explanations in Traditional Chinese)
- SurveyMonkey — How To Measure Customer Experience (Best practices for measuring customer experience)
- 管理王 AI.com.tw — Customer Satisfaction Dashboard Feature Page (Integration of three major metrics and function description)