How to Design a Survey That People Will Fill Out? Process from Design, Distribution to Analysis|Survey Tool Recommendations

How to design a survey that people will fill out? This article covers the complete process of designing, distributing, and analyzing corporate surveys, including clarifying the purpose, selecting six types of questions, setting logic jumps, comparing four distribution channels, analyzing NPS and CSAT indicators, and protecting personal data.
Surveys are the most direct way for businesses to collect customer opinions, employee feedback, and market information. Creating a good survey requires handling three aspects: design, distribution, and analysis—all of which impact response rates. This article explains how to ensure that surveys are completed and useful for analysis, suitable for managers and marketers looking to establish a corporate survey process.
Why Do Surveys Have Low Response Rates? Understand the Five Major Barriers to Filling Them Out
Many companies receive a response rate of less than 20% after sending out surveys, often because the survey itself has set too many barriers:
- Too many questions: If there are more than 15 questions or it takes over 5 minutes to complete, abandonment rates significantly increase.
- Unclear questions: A question like "How satisfied are you with our service overall?" combines two meanings: service quality and overall impression, leaving respondents unsure of how to answer.
- Text-heavy without visual hierarchy: Large blocks of text that are unbroken look complex, leading respondents to abandon the survey before starting.
- No feedback after completion: If respondents don't know the purpose of filling out the survey or whether results will be published, their willingness decreases.
- Poor timing of distribution: Sending a survey three days after purchase can lead to forgotten memories; sending surveys during peak complaint periods can interfere with responses.
In a nutshell
The ceiling for survey response rates is determined by the "cost of respondent effort, " so prioritize making it "easy to fill out" during design.
Step One of Survey Design: Clarify Purpose, Audience, and Usage
Before opening any survey tool, answer three questions:
1. What question does this survey aim to answer?
The clearer the purpose, the more precise the questions. "Understand customer satisfaction" is too vague; "Identify the ratings of customers aged 30 to 45 regarding delivery timeliness and compare them with last quarter" is a more actionable purpose.
2. Who are the respondents?
Employee surveys, customer surveys, and potential customer surveys have completely different design logic. Employee surveys require anonymity; customer surveys need to be linked to purchase records; potential customer surveys must capture key screening information in the shortest possible time.
3. What decisions will be made based on the analysis of results?
If the results won't change anything regardless, it's not worth sending out a survey—this will erode trust with respondents, leading to lower response rates next time.
Once these three points are clarified, the number of survey questions, types, and order will naturally converge.
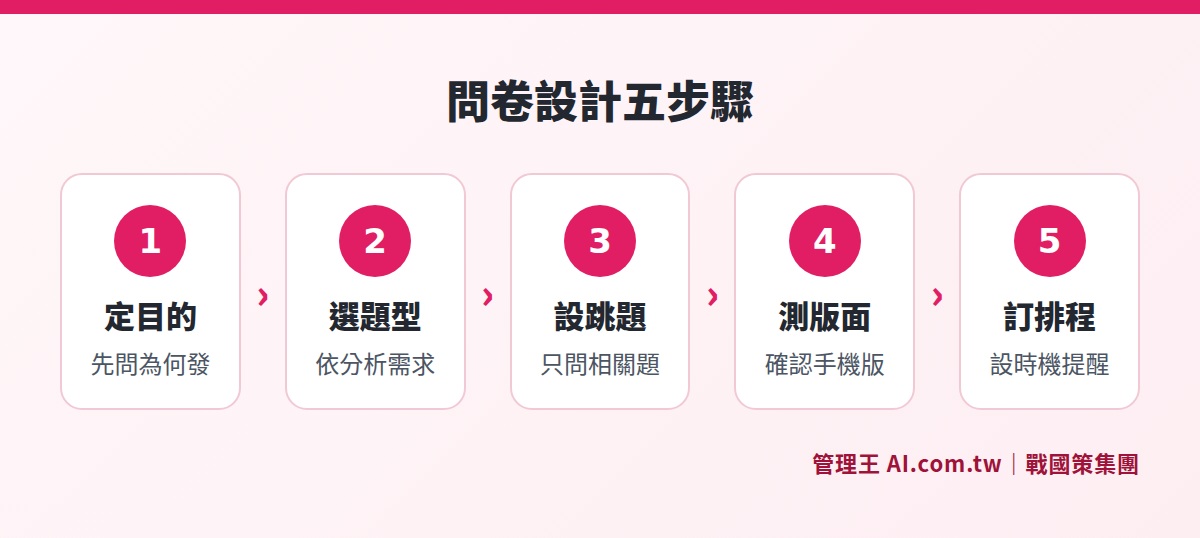
The complete design process from clarifying purpose to question type selection, logic jumping, layout testing, and scheduling.
Six Common Question Types: Which One to Choose for Different Situations?
Choosing the wrong question type can make data difficult to analyze. Here is a comparison of the six types most commonly used by companies:
Table: Guide to Using Six Survey Question Types
| Question Type | Applicable Situations | Main Advantages | Points to Note |
|---|---|---|---|
| Single Choice | Mutually exclusive options like age, gender, purchase channels | Clean and easy to analyze data | Options must be exhaustive and mutually exclusive; can add "other" |
| Multiple Choice | Which features have you used? What notification methods do you accept? | Close to real behavior | Analyze selected combinations rather than simple totals |
| Open Text | Collect specific suggestions and free opinions | Capture unexpected information | Requires manual classification or AI-assisted sorting |
| Rating Scale (1-5 or 1-10) | Satisfaction and importance ratings | Can be used for trend comparison | Design clear endpoint explanations for the scale |
| Matrix | Evaluate multiple aspects at once (speed, quality, service) | Saves layout space | More than 5 rows may lead to fatigue effect |
| NPS Question | Overall willingness to recommend (0 to 10) | Inter-industry comparability | Needs accompanying open questions to find out reasons |
The core principle of question type selection is "design what is needed for analysis." If you need to calculate average scores, choose a rating scale; if you want to identify high-frequency terms, open text plus AI summary is the most efficient; if you want to track long-term brand loyalty, use the NPS question and follow up regularly.
Logic Jumps: Show Each Respondent Only Relevant Questions
Logic jumps (Conditional Logic) are one of the most effective tools to improve survey completion rates. The basic logic settings are as follows:
Trigger Condition Setting
Select "No, I have not used this feature" → skip the subsequent user experience questions and move directly to the next section. This avoids confusion for respondents by not showing questions that are irrelevant to them.
Segmented Display
B2B customers see procurement process-related questions, while B2C customers see personal consumption experience questions. Include a screening question in the earlier part of the survey, and then automatically switch subsequent questions based on the answer, allowing one survey to serve two respondent groups simultaneously.
Avoid Exposing Logic Jump Traces
After a jump, there should be no blank spaces on the screen for skipped questions; otherwise, respondents may feel confused or even think the system is malfunctioning.
Correctly using logic jumps can reduce the actual number of questions answered by each respondent without changing the total number of questions, significantly increasing the completion rate.
Survey Length and Layout: Key Details Affecting Completion Rates
Number of Questions and Estimated Time:
- 8 to 12 questions (within 3 minutes): Highest completion rate, suitable for common customer surveys.
- 15 to 20 questions (within 5 minutes): Suitable for highly engaged employee surveys or VIP customer surveys.
- More than 20 questions: Unless respondents have a clear motivation (incentives or actively participating in research), the completion rate will significantly drop.
Five Layout Details That Affect Respondent Costs:
- Display an Answer Progress Bar: Let respondents see how much is left; the feeling of "almost there" can reduce abandonment rates.
- Mobile Auto-Optimization: Ensure buttons are large and no horizontal scrolling is required, as the percentage of mobile responses is continuously rising.
- One Topic per Page: Avoid cramming all questions onto one page; pagination makes each page look easier.
- Warm-up Questions at the Start: Start with easy questions like "When was your last purchase?" before asking about "satisfaction levels?".
- Sensitive or Complex Questions in the Middle or Later Sections: Ask these only after the respondent has engaged, as refusal rates are lower then.
How to Distribute Surveys? Comparison of Four Channels for Response Rates
Different distribution channels are suitable for different target audiences and situations.
Table: Comparison of Survey Distribution Channels
| Distribution Channel | Most Suitable Audience | Advantages | Notes |
|---|---|---|---|
| LINE Messages | Members or employees who have joined the LINE official account | Higher open rates than email, immediate reach | Long messages may get cut off; use short links |
| B2B customers, newsletter subscribers | Can include background explanations, more formal feel | Subject line determines open rates, avoid Monday mornings | |
| QR Code (On-site) | Event attendees, in-store customers | Immediate high response rates, fill out while engaged | Ensure reliable onsite Wi-Fi or data connectivity |
| Embedded on Webpage | Website visitors, visitors on post-checkout pages | Low-cost continuous collection | Design triggering moments to avoid pop-ups as soon as the page opens |
Timing of Sending is Also Important:
- Customer Satisfaction Surveys: Send within 24 to 48 hours after purchase or service completion, when memories are freshest.
- Employee Engagement Surveys: Quarterly distribution, avoiding performance evaluation periods and peak business seasons.
- Post-event Feedback: Send within 72 hours after an event, while memories are still vivid.
- Course Evaluations: Trigger immediately after course completion, do not delay beyond a day.
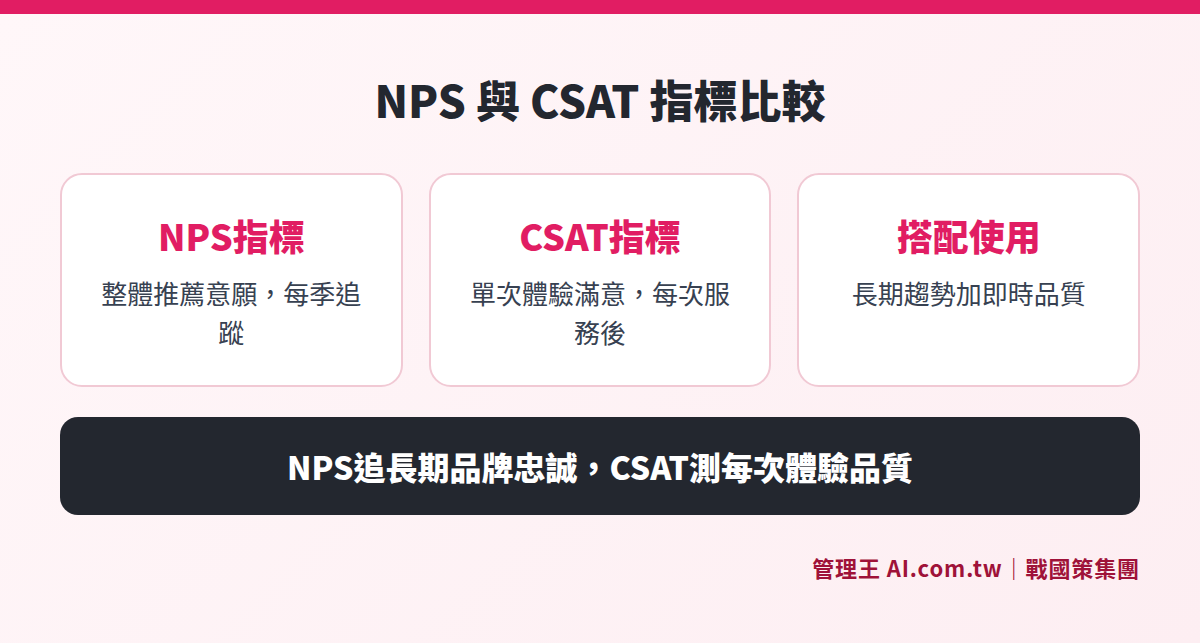
NPS tracks overall brand loyalty, while CSAT measures satisfaction with individual experiences; using both provides a complete view.
How to Analyze Responses? Three Steps from Data to Insights
After receiving survey responses, many companies only look at the average score and conclude. To truly bring value from the data, three levels of analysis are necessary:
Step One: Descriptive Statistics to Observe Overall Distribution
Don't just look at the average score; observe the distribution. An average rating of 8 could arise from "everyone gave an 8" (stable) or "half gave a 10, half a 6" (polarized). The latter requires grouping; the former indicates genuinely stable positive feedback.
Step Two: Cross-Analysis to Identify Meaningful Differences
Cross-reference satisfaction results with other dimensions:
- Are there significant satisfaction differences among customers from different purchasing channels?
- What is the NPS difference between new and old customers?
- Which department has the lowest employee engagement?
Differences found through cross-analysis are the starting point for improvement actions. If the overall average is 7 but a specific channel has an average of 4, the issue is with that channel, not the overall product.
Step Three: Organize Open Questions to Distill Qualitative Insights
Open-ended comments often contain the most valuable information, but manually reading hundreds of comments is time-consuming. AI summarization tools can automatically categorize hundreds of comments into a few themes and highlight high-frequency terms, allowing managers to grasp overall sentiment quickly and identify recurring issues.
NPS and CSAT: The Two Most Commonly Tracked Indicators by Businesses
What is NPS?
NPS (Net Promoter Score) only asks one question: "How likely are you to recommend us to friends and family? (0 to 10)"
Calculation method:
- 9 to 10: Promoters
- 7 to 8: Passives
- 0 to 6: Detractors
- NPS = % of Promoters - % of Detractors
NPS allows for comparisons across industries and over time, serving as a long-term tracking indicator for brand health, ideally surveyed quarterly or semi-annually. The NPS concept was introduced by Fred Reichheld of Bain & Company in 2003 and has since become one of the primary tools for assessing customer loyalty globally.
What is CSAT?
CSAT (Customer Satisfaction Score) measures satisfaction with a specific interaction, usually using a scale of 1 to 5 or 1 to 10, measured immediately after each service to reflect the quality of individual experiences.
CSAT is more sensitive than NPS, suitable for tracking issues immediately after customer service work is completed, after-sales services, or product unboxing, allowing for the immediate identification of specific process issues.
How to Pair NPS and CSAT?
NPS tracks overall brand loyalty, while CSAT tracks the quality of individual experiences. Using both allows businesses to see long-term trends and immediate problems simultaneously: a drop in NPS over two consecutive quarters indicates a loss of brand trust, while a sudden drop in CSAT during a particular week may signal a specific service issue, necessitating different interpretations and improvement directions.
Three Common Mistakes in Survey Analysis
Many businesses make the following mistakes when analyzing surveys, leading to incorrect conclusions:
Mistake One: Only Looking at Averages, Ignoring Distribution
If satisfaction averages 7, it could mean everyone gave a 7 (stable) or that half gave a 9 and half a 5 (polarized). These two situations require completely different improvement strategies, and looking at averages alone may obscure issues.
Mistake Two: Drawing Conclusions from Too Small a Sample
Claiming "customers are very satisfied" based on 10 responses is not representative. It is generally recommended to collect at least 30 responses from the same group for preliminary statistical analysis; for cross-analysis, each subgroup should also reach 30 responses.
Mistake Three: Treating Surveys as the Only Data Source
Surveys reflect what "respondents are willing to say," which may not equate to "actual behavior." It is advisable to cross-validate insights with purchase data from CRM and issue categories from customer service tickets for greater reliability.
Surveys and Personal Data Protection: Regulations Businesses in Taiwan Must Know
According to the Personal Data Protection Act (Ministry of Justice, National Regulations Database), businesses have the following obligations when collecting personal data through surveys:
Collection Principles:
- Before collecting personal data, respondents must be informed of the purpose of collection, data categories, usage period, and method, and obtain consent.
- Only collect data directly related to the survey purpose, avoiding over-collection (e.g., customer satisfaction surveys generally do not require collection of ID numbers).
- Truly anonymous surveys (which cannot identify specific individuals) fall outside the scope of data protection laws, but it must be ensured that data cannot be traced back to individuals.
Special Notes on Employee Surveys:
Employee surveys sent by employers may pressure respondents due to their subordinate relationship, affecting the authenticity of responses. Recommended practices include:
- Using anonymous designs without collecting identifiable fields like names or employee IDs.
- Having a third-party tool collect the data so that employers only see aggregated results, not individual answers.
- Clearly explain the anonymity protection mechanism at the beginning of the survey to assure employees.
When Survey Use Involves Marketing:
If survey results are to be used for subsequent marketing promotions, respondents must be clearly informed at the beginning of the survey, and given the option to decline. Using results for marketing without notification may violate personal data laws.
Use the Management King Survey Tool for a One-Stop Solution from Design to Analysis
Management King AI.com.tw Survey Tool is integrated into the customer service system, native to CRM System, Customer Service Ticket System, and Customer Satisfaction Dashboard, eliminating the need for API integration costs.
Actual Operation Process:
- Create a Survey: Start from a template or blank form, choose question types (single choice, multiple choice, open text, rating, matrix, NPS), set mandatory and optional questions, and add an answer progress bar.
- Set Logic Jumps: Drag-and-drop interface allows setting up conditions like "If answer A, skip to question X" without programming.
- Schedule Distribution: Choose trigger conditions (automatically send after ticket closure) or regular schedules (automatically send to all members every 1st of the month), supporting three distribution channels: LINE, Email, QR Code.
- Set Reminder for Non-respondents: Automatically send reminders on the 3rd and 7th days for non-respondents without manual tracking of recovery progress.
- View Dashboard: Automatically calculate average scores, NPS groupings, CSAT trends after collection; open-ended questions are summarized automatically by AI into several themes, presenting overall sentiment on one page.
The Marketing Automation module can further connect survey results with membership points, for example, automatically distributing points as rewards upon completion of the survey to improve response rates. The AI Customer Service Center can also automatically trigger follow-up care processes for low-rated customers after survey collection.
The free plan allows permanent use, including basic survey functions; upgrading provides access to AI summaries and advanced cross-analysis. For a complete comparison of plans, please refer to the Management King pricing page.
Try the Survey Tool for Free and Start Collecting Feedback Today
Management King consultants assist you in establishing customer and employee survey processes, completing everything from question design to automatic analysis, with a free plan available for permanent use.
Free consultation hotline: 0800-003-191
LINE Official Account: @119m
Official Website: app.AI.com.tw
Free Trial: Apply for Management King Now
Frequently Asked Questions
How Many Questions Are Most Suitable for a Survey?
It is generally recommended to keep it between 8 to 12 questions and complete within 3 minutes. Employee engagement surveys or research surveys can extend to 20 questions, but they should use logic jumps to ensure that each respondent does not answer more than 15 questions in total. For surveys with over 20 questions, it is advisable to split them into two parts and send them in batches to avoid respondent fatigue and abandonment.
When is the Best Time to Send Surveys for Higher Response Rates?
The best time for customer surveys is 24 to 48 hours after the purchase or service completion, as memories are freshest and emotions are most vivid. For email surveys, it is recommended to send them on Tuesday or Wednesday mornings, as open rates are relatively higher during this period. Avoid Monday mornings (when emails pile up) and Friday afternoons (as people prepare to finish the workweek).
What Is a Good NPS Score?
There is no universal pass mark for NPS, as it varies greatly across industries and markets; what matters is the horizontal comparison within the same industry and the longitudinal trend of one's own score. Generally speaking, an NPS higher than 50 is considered excellent. Small and medium-sized enterprises in Taiwan are advised to track changes each quarter, as consecutive declines over two quarters indicate a need for investigation and improvement actions.
How to Ensure Employee Survey Responses Are Authentic?
The key is the "transparency of anonymity mechanisms." Clearly explain at the beginning of the survey: results are collated by a third-party system, and supervisors only see aggregated statistics, not individual answers. Additionally, the company must first establish a sense of psychological safety. If there have been previous instances where individuals were held accountable for their answers after surveys, even emphasizing anonymity will not encourage truthful responses from employees.
Can Survey Results Be Used for Marketing Promotions?
Yes, but according to the Personal Data Protection Act, if the purpose of data collection for the survey includes marketing promotions, respondents must be clearly informed at the time of data collection and given an option to refuse. Using results for marketing without prior notification could violate personal data regulations, so it is advisable to confirm data usage and include this statement during the initial design of the survey.
Data Sources
- Personal Data Protection Act, Ministry of Justice National Regulations Database, 2023 Revised Edition
- Taiwan Social Change Basic Survey (TSCS), Institute of Sociology, Academia Sinica
- Explanation of Net Promoter Score, SurveyMonkey, Explanation Page for NPS Metrics
- Management King Survey Tool Features Page, Management King AI.com.tw, Retrieved October 2026
This article is for general informational purposes only and does not constitute legal or tax advice; actual laws and regulations should be confirmed with the relevant authorities.